Mass data: your crystal ball to trade smarter!


Don't be a blind trader anymore!
No one has a crystal ball, and Mass won't help you get one, but the wide variety of data will almost act like you have it!
Let's dive into the heart of Mass data to trade smarter!
Download Mass on the Apple Store
Download Mass on the Google Store
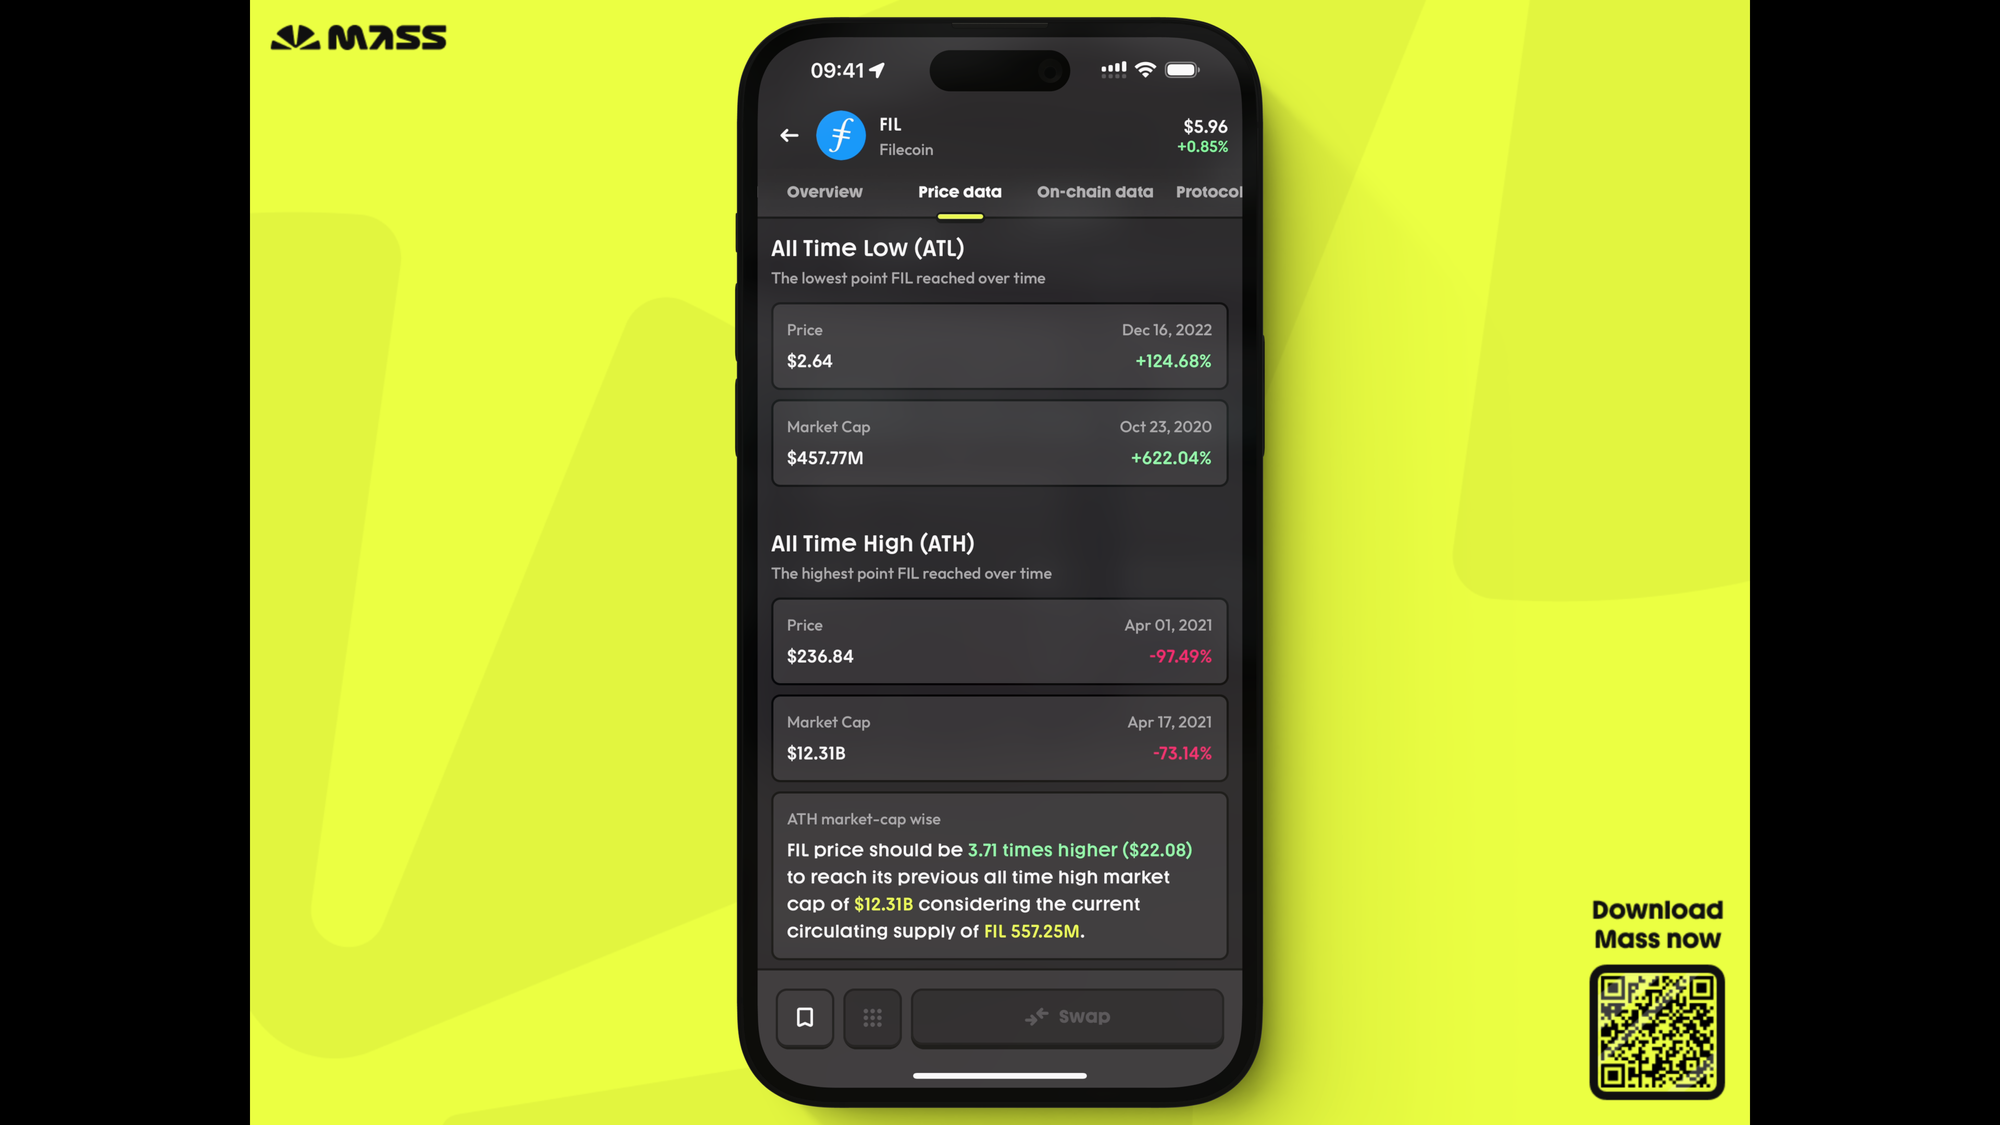
ATL, ATH & ATH market cap wise 📉📈
We all know what is the ATL & the ATH!
Mass makes a difference between ATL/ATH in price vs. in market cap.
We developed a new parameter called "ATH market cap wise," which calculates the price a token must trade at to reach its previous ATH market cap, considering the current circulating supply.
In other words, this parameter considers token inflation!
To reach its 2021 market cap ATH, $FIL must reach $22.08, which is 10 times less than its price in 2021! #SFYL
Download Mass on the Apple Store
Download Mass on the Google Store
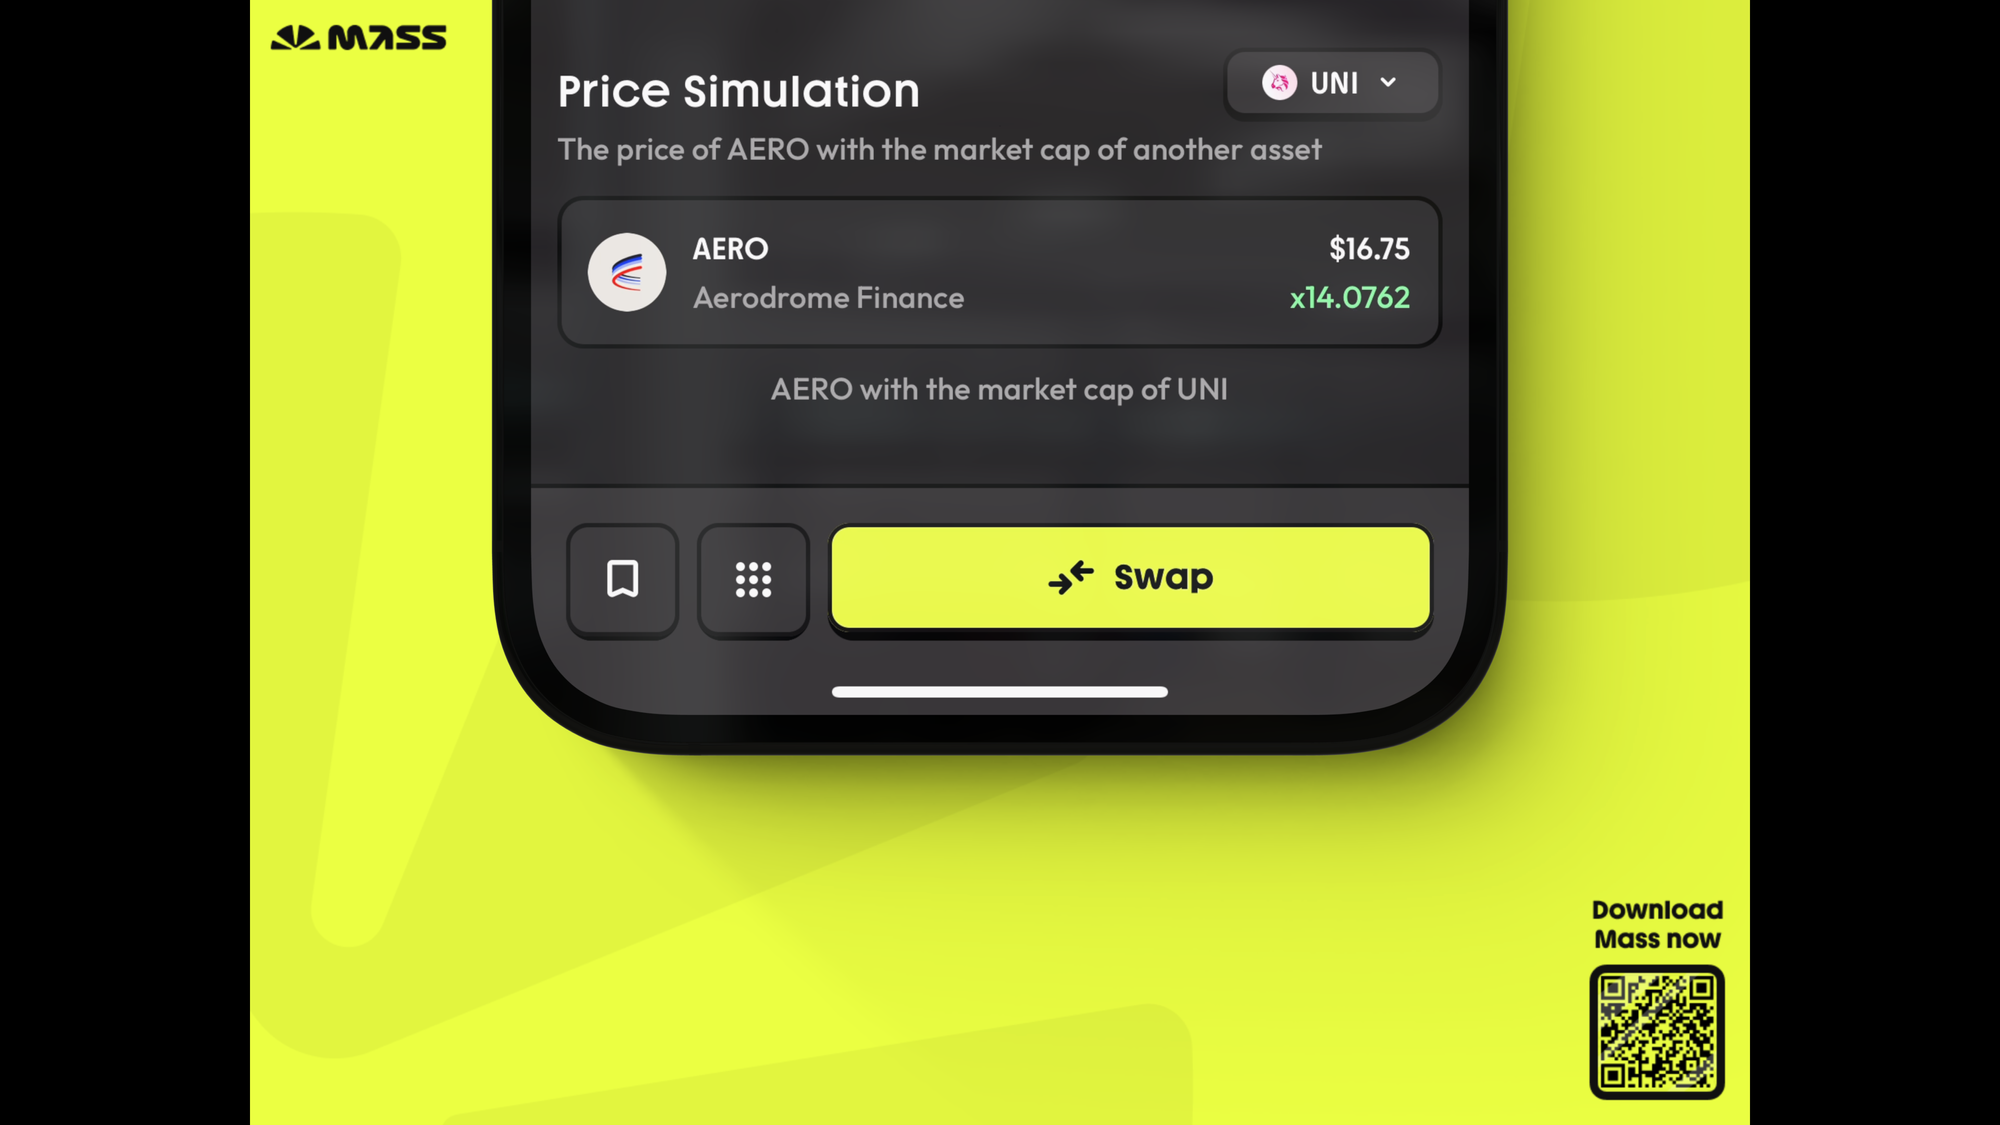
Price simulation 🔃
You can estimate an asset's price with another asset's market cap.
Here, we can see that $AERO needs to increase 14x to catch up with $UNI, the competitor and leader in this category!
Download Mass on the Apple Store
Download Mass on the Google Store
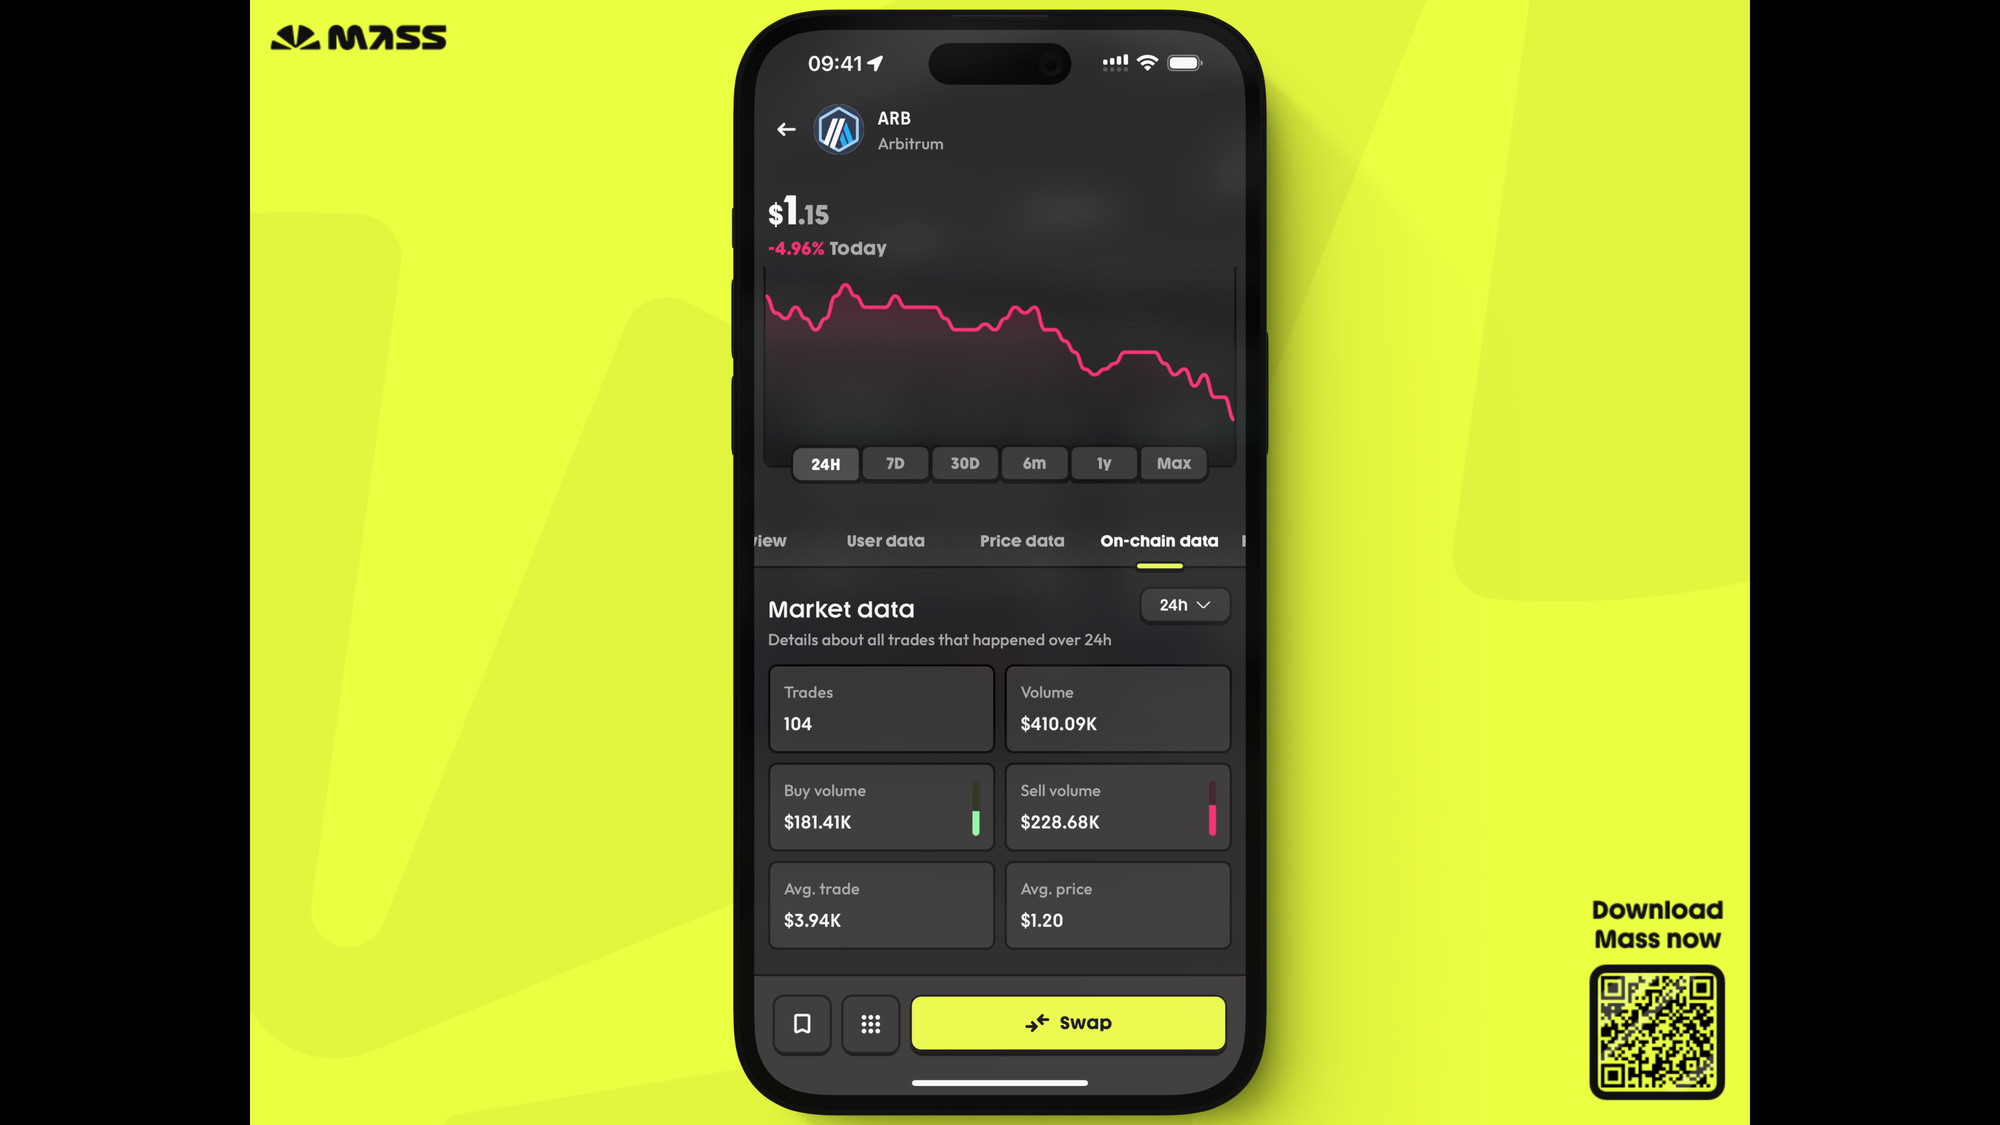
Market Activity 📊
Look at what's happening on-chain!
The number of swaps, the average trading size or price, and the volume exchanged over 24 hours, 7 days, and 1 month!
This section gives you insight into traders' profitability!
Are traders profitable? $ARB buyers have lost money over the past 24 hours!
Download Mass on the Apple Store
Download Mass on the Google Store
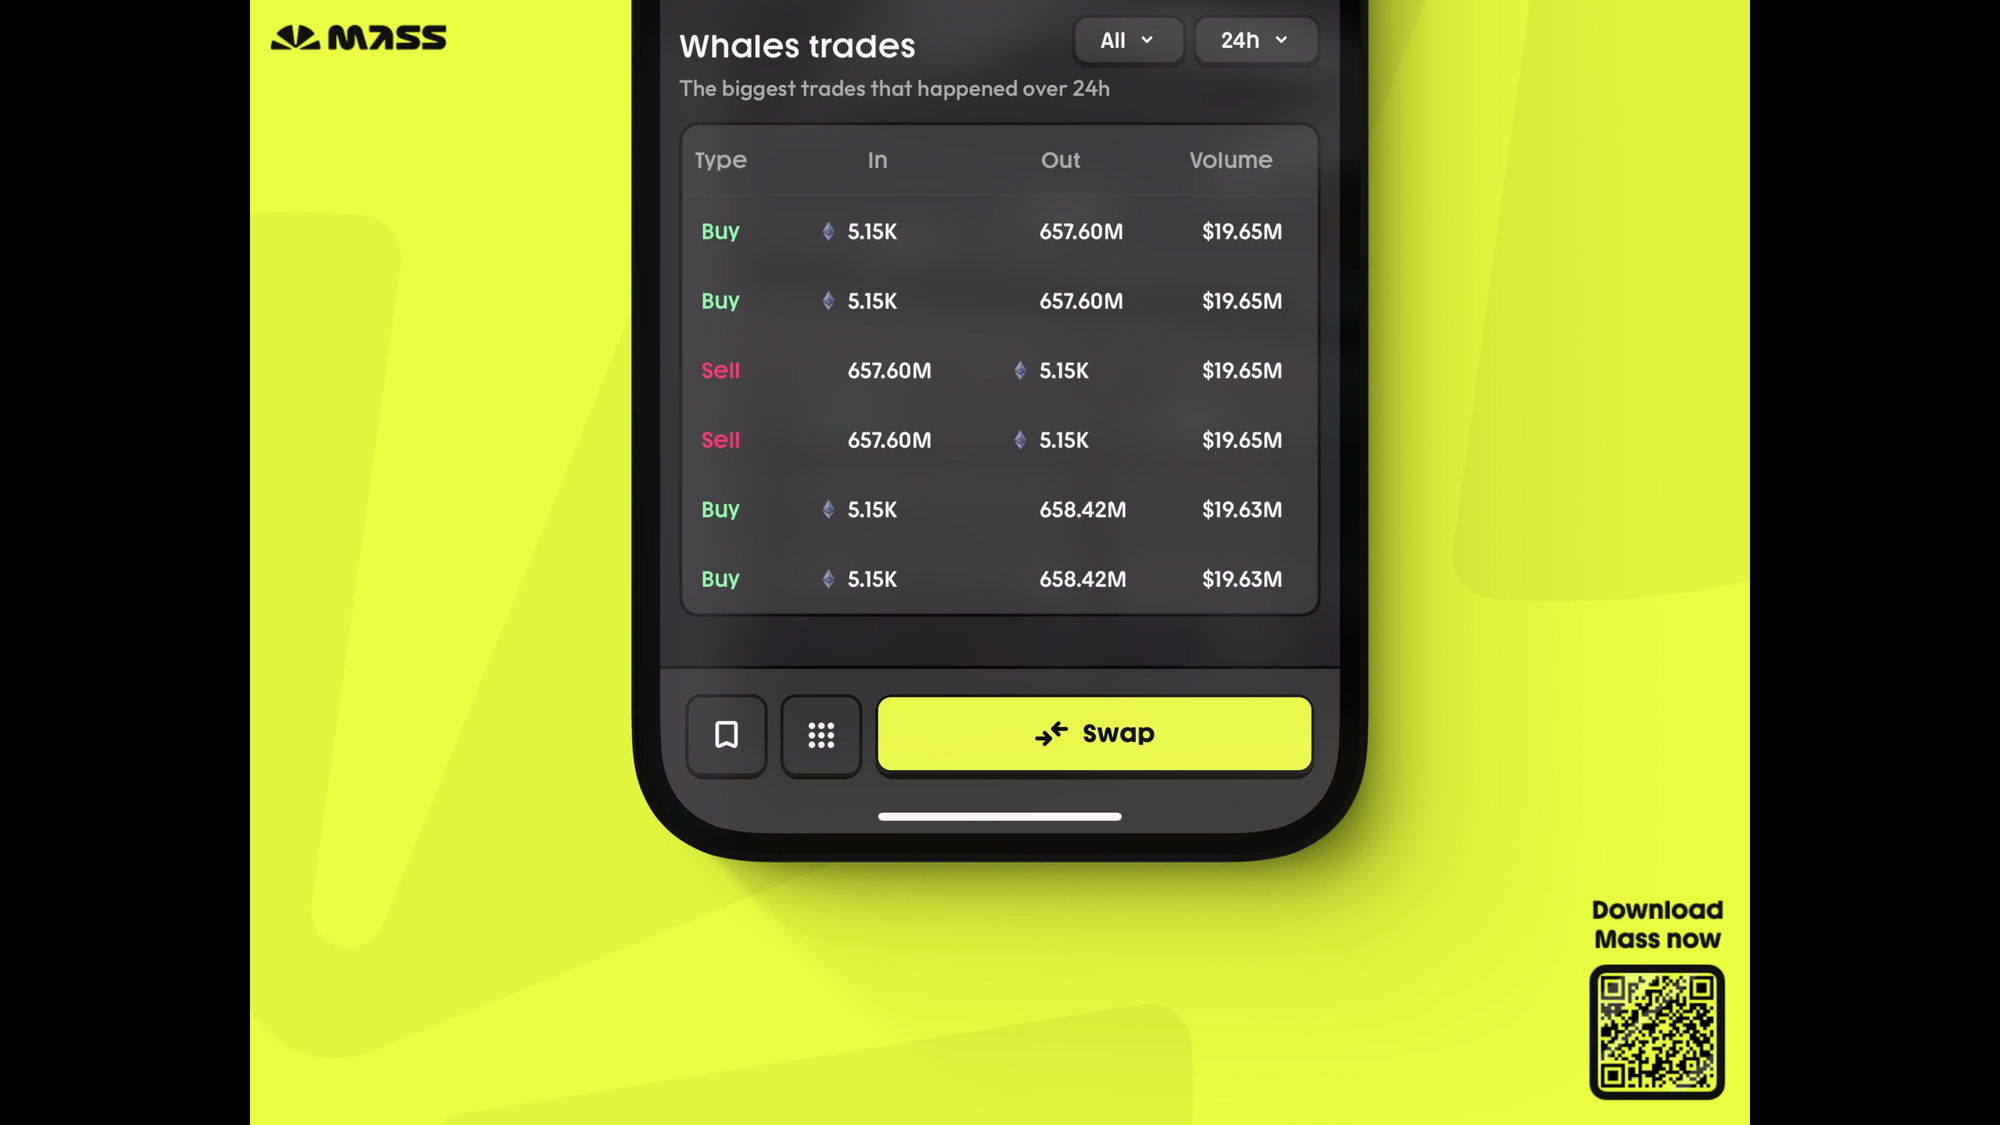
Whales trades 🐳
This section shows you the biggest buying or selling trades over the past 24 hours or 7 days.
What orders moved the market? You can find them there!
Download Mass on the Apple Store
Download Mass on the Google Store
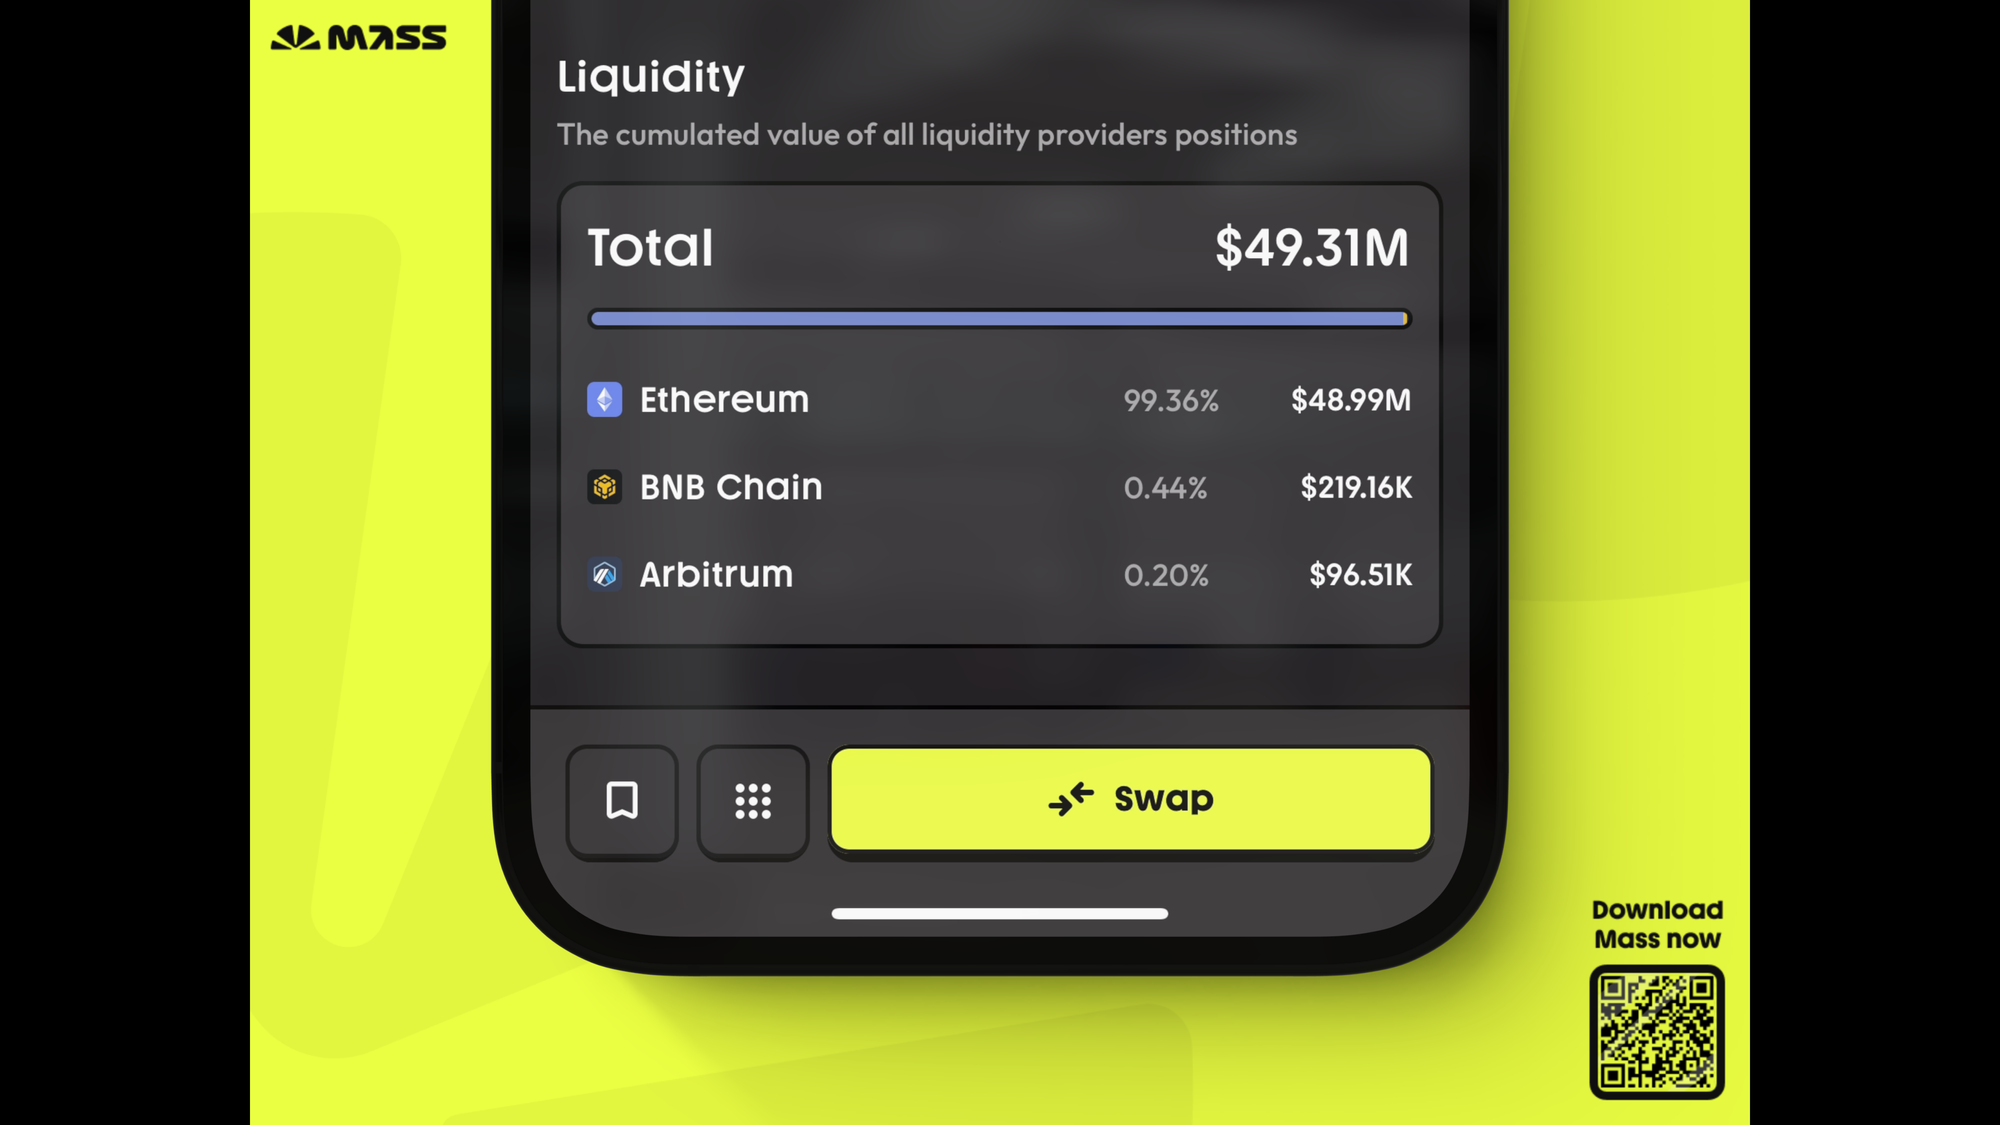
On-chain liquidity 🏊
Is a token liquid on-chain? If so, which chain should you use to trade it?
With this indicator, you can find the best avenue to trade an asset and know what size you should trade with!
Download Mass on the Apple Store
Download Mass on the Google Store
CEXs flows 🏦
What is the USD value of all deposits and withdrawals on centralized exchanges for a specific token?
The more withdrawals, the more bullish, the more deposits, the more bearish!
Three days ago, $65M worth of $OP was deposited on Binance 🐻

Download Mass on the Apple Store
Download Mass on the Google Store
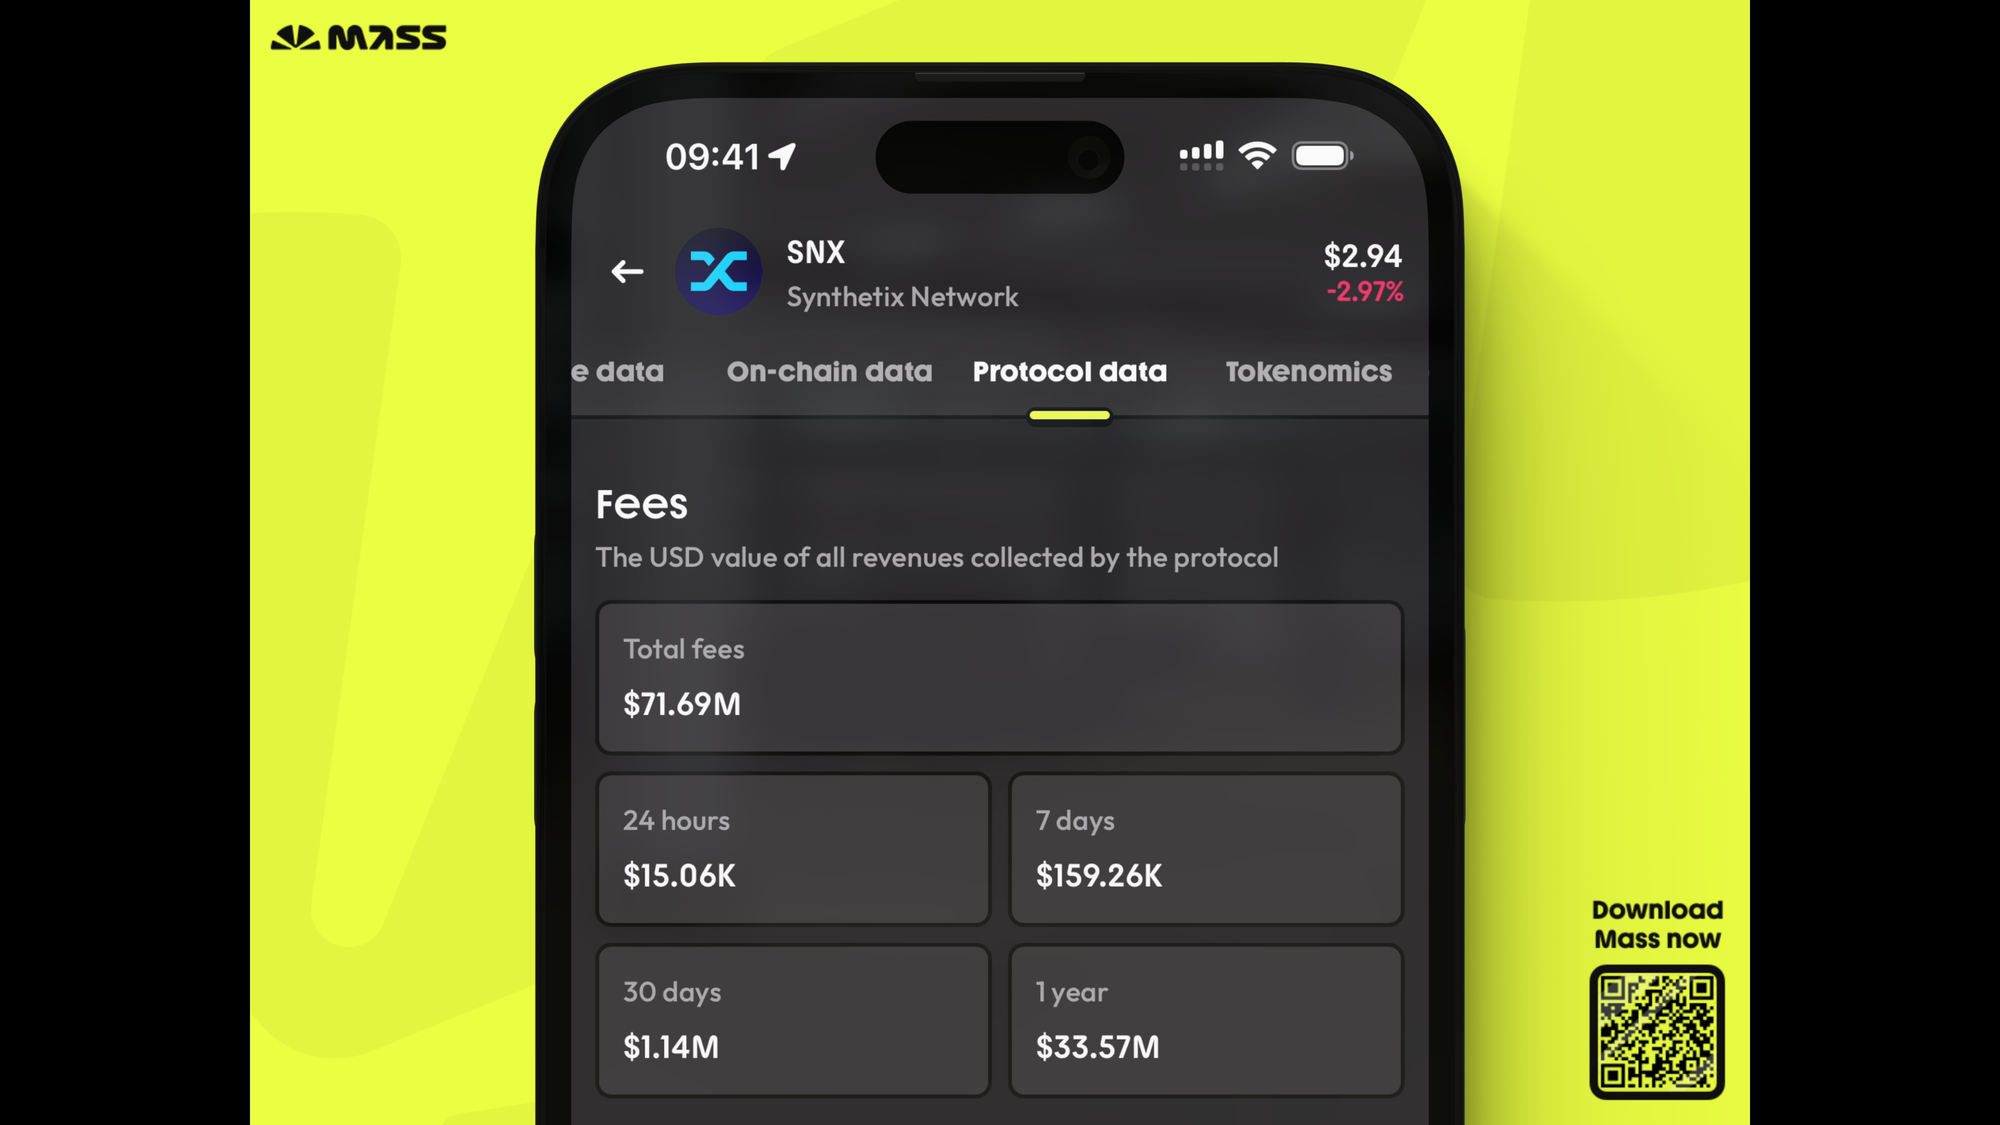
Protocol fees 💸
This section shows how much fees a protocol generated over the past 24 hours, 7 days, 30 days, and 1 year!
Since inception, Synthetix has generated $71.7M!
Not so bad, not so bad!
Download Mass on the Apple Store
Download Mass on the Google Store
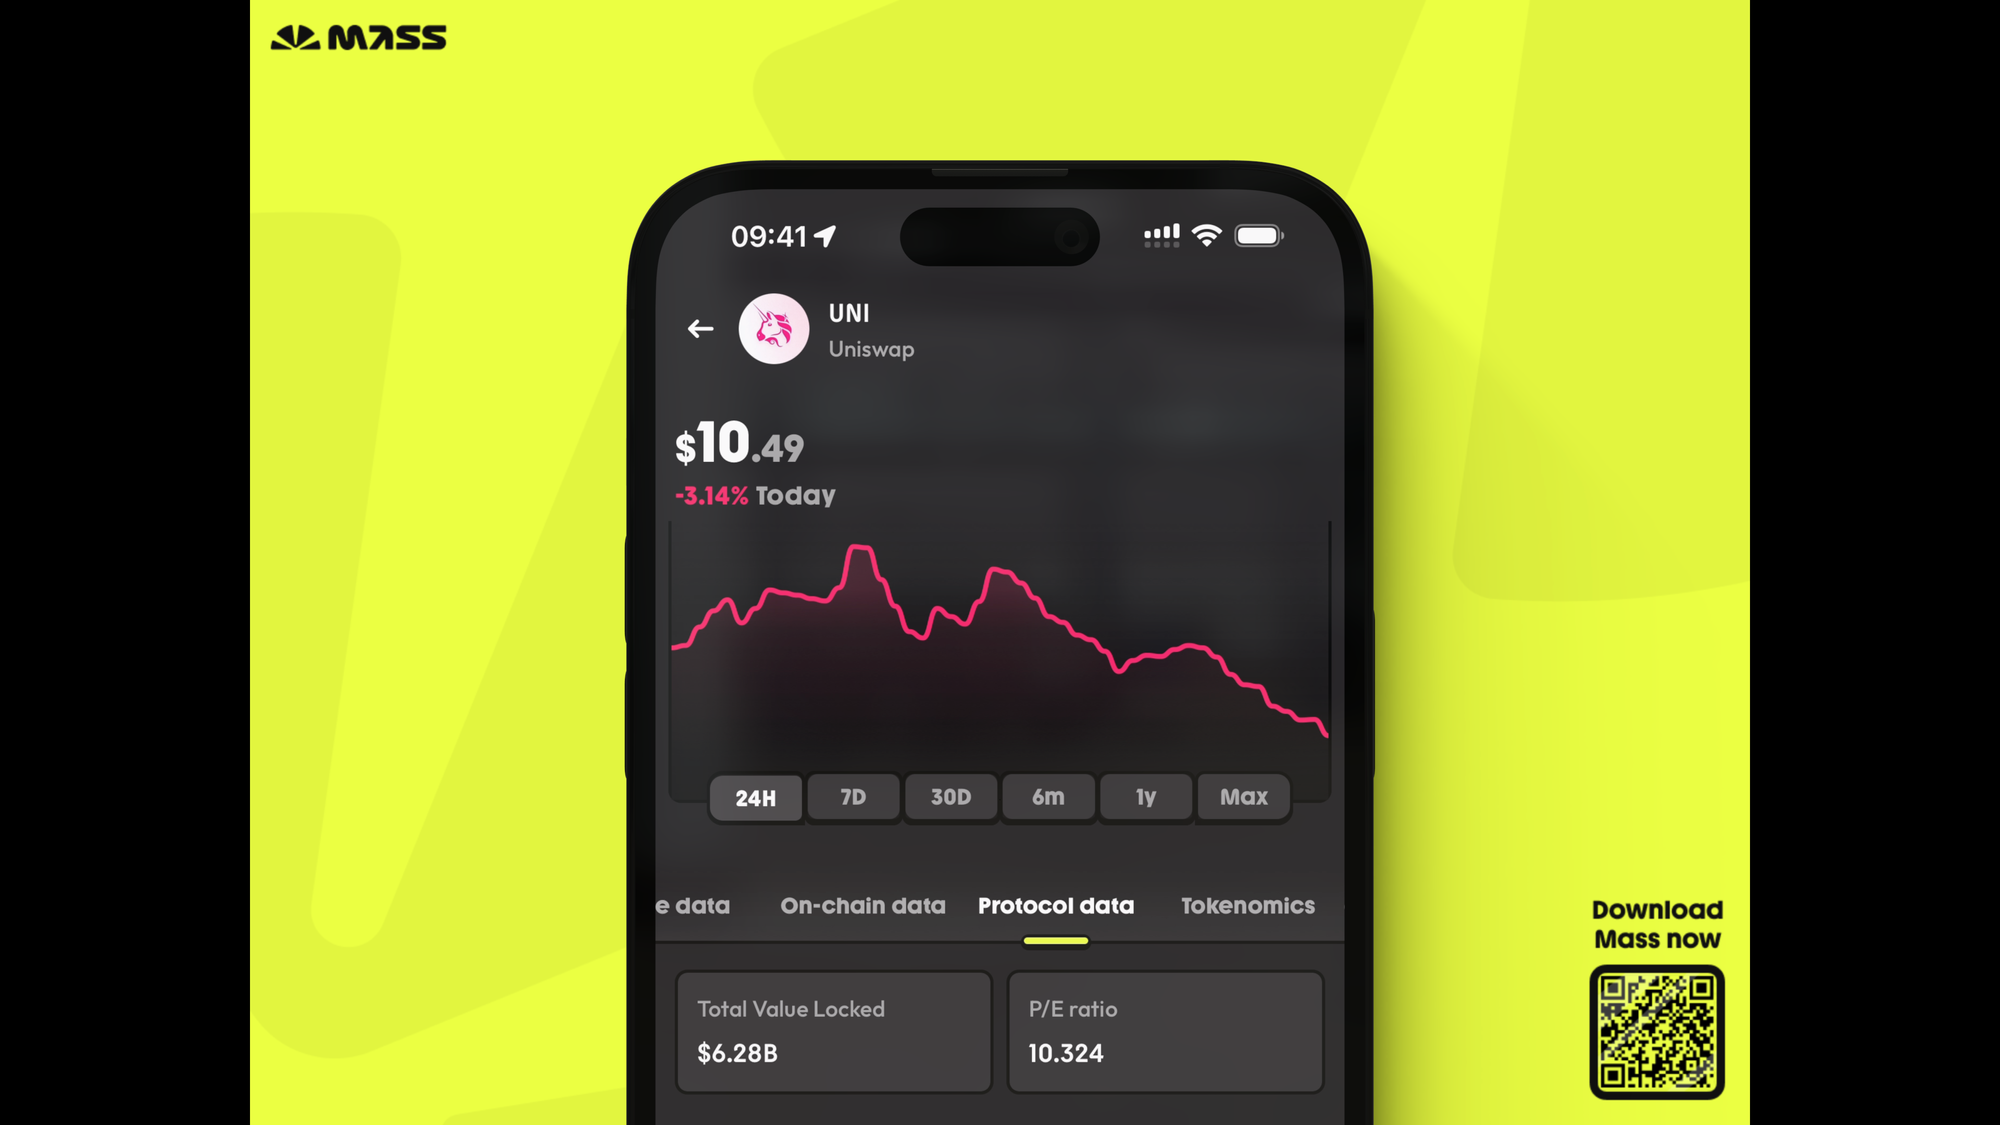
TVL & P/E ratio 🔍
The TVL shows the amount locked in a protocol.
The P/E (Price/Earning) ratio is the ratio between a token's market capitalization and the fees generated over one year by the underlying protocol!
The lower the P/E ratio, the better for token holders!
Uniswap, when fee switch? 👀
Download Mass on the Apple Store
Download Mass on the Google Store
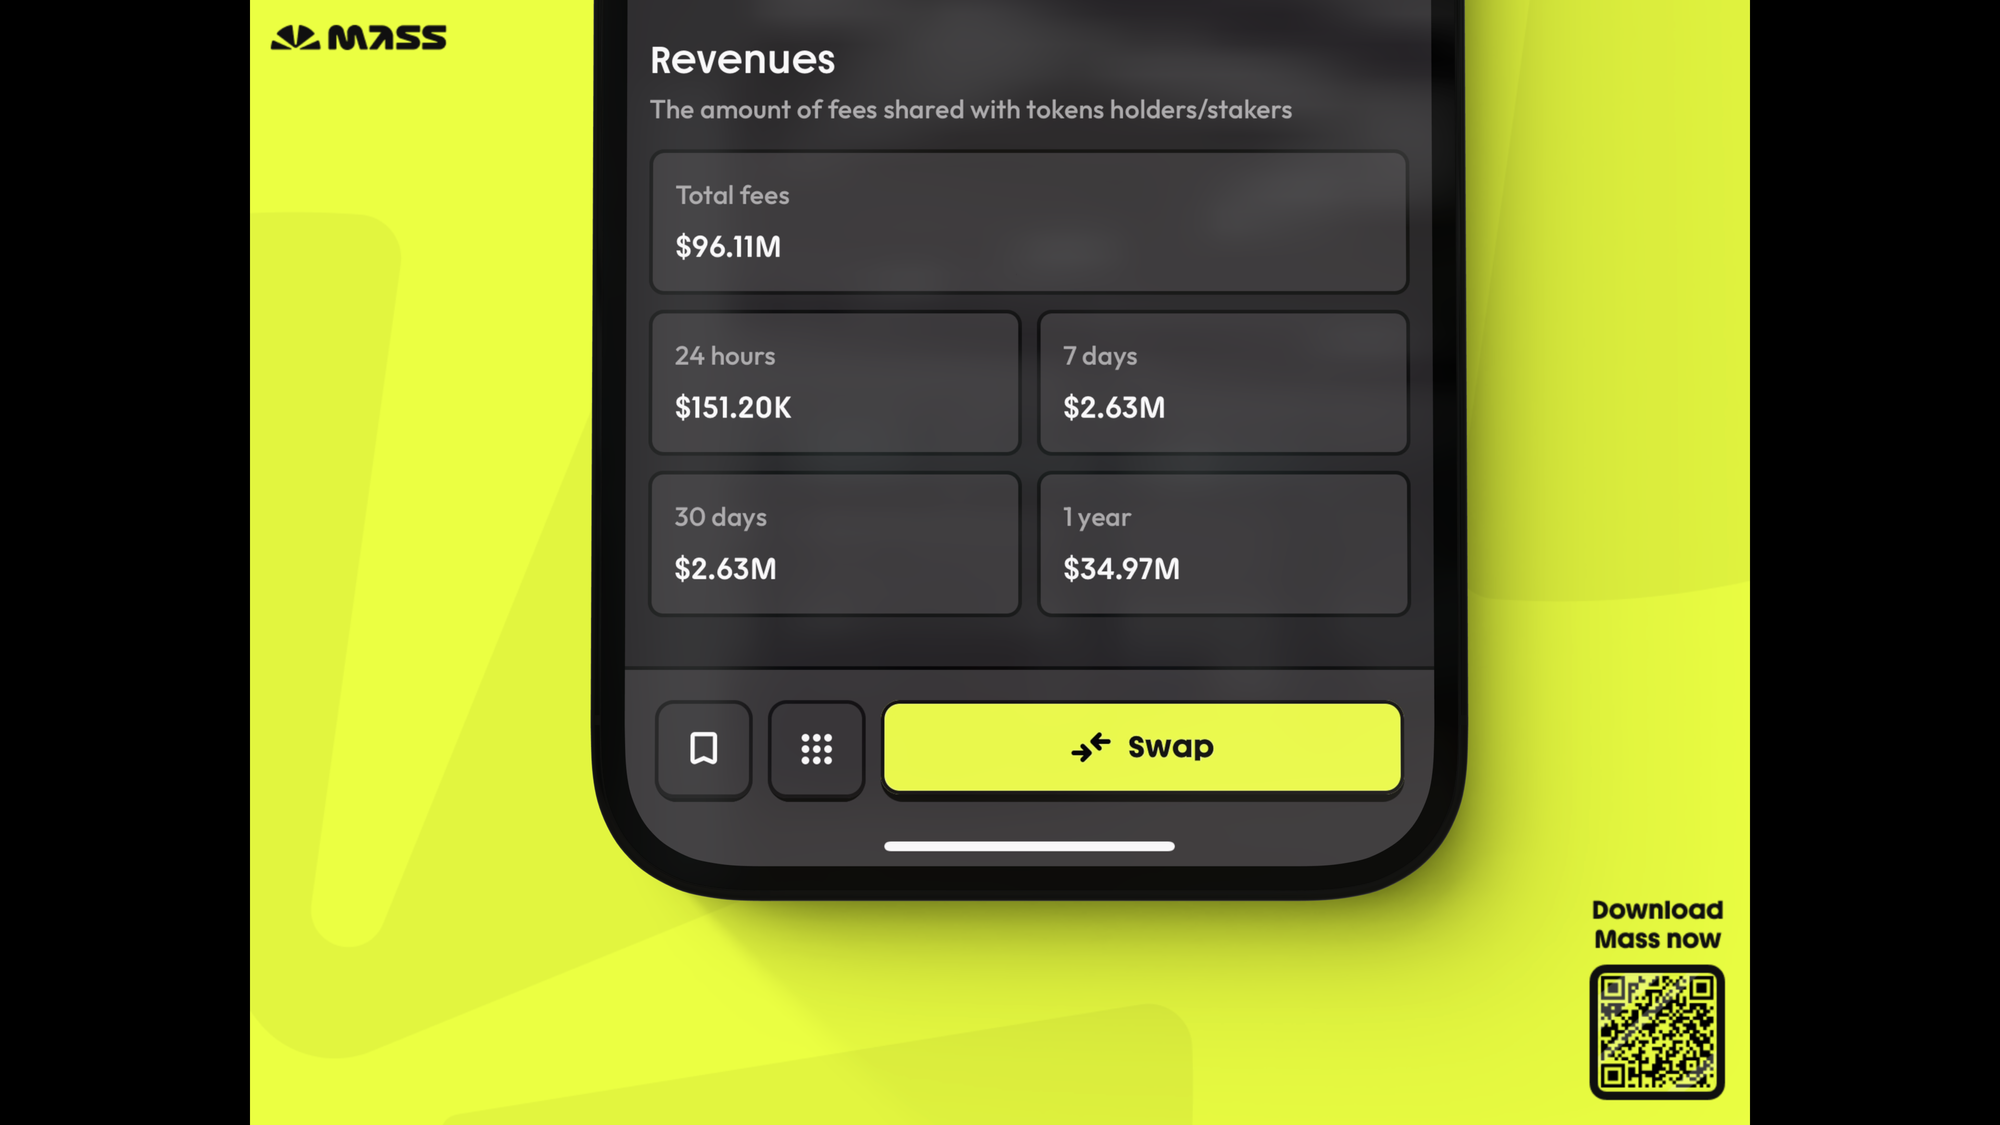
Tokens holders' revenues 🤑
This section shows the USD value of all fees a protocol shared with its token holders over 24 hours, 7 days, 1 month, 1 year, and since inception!
$GMX holders must be happy with nearly $100M earned from fee sharing!
Download Mass on the Apple Store
Download Mass on the Google Store
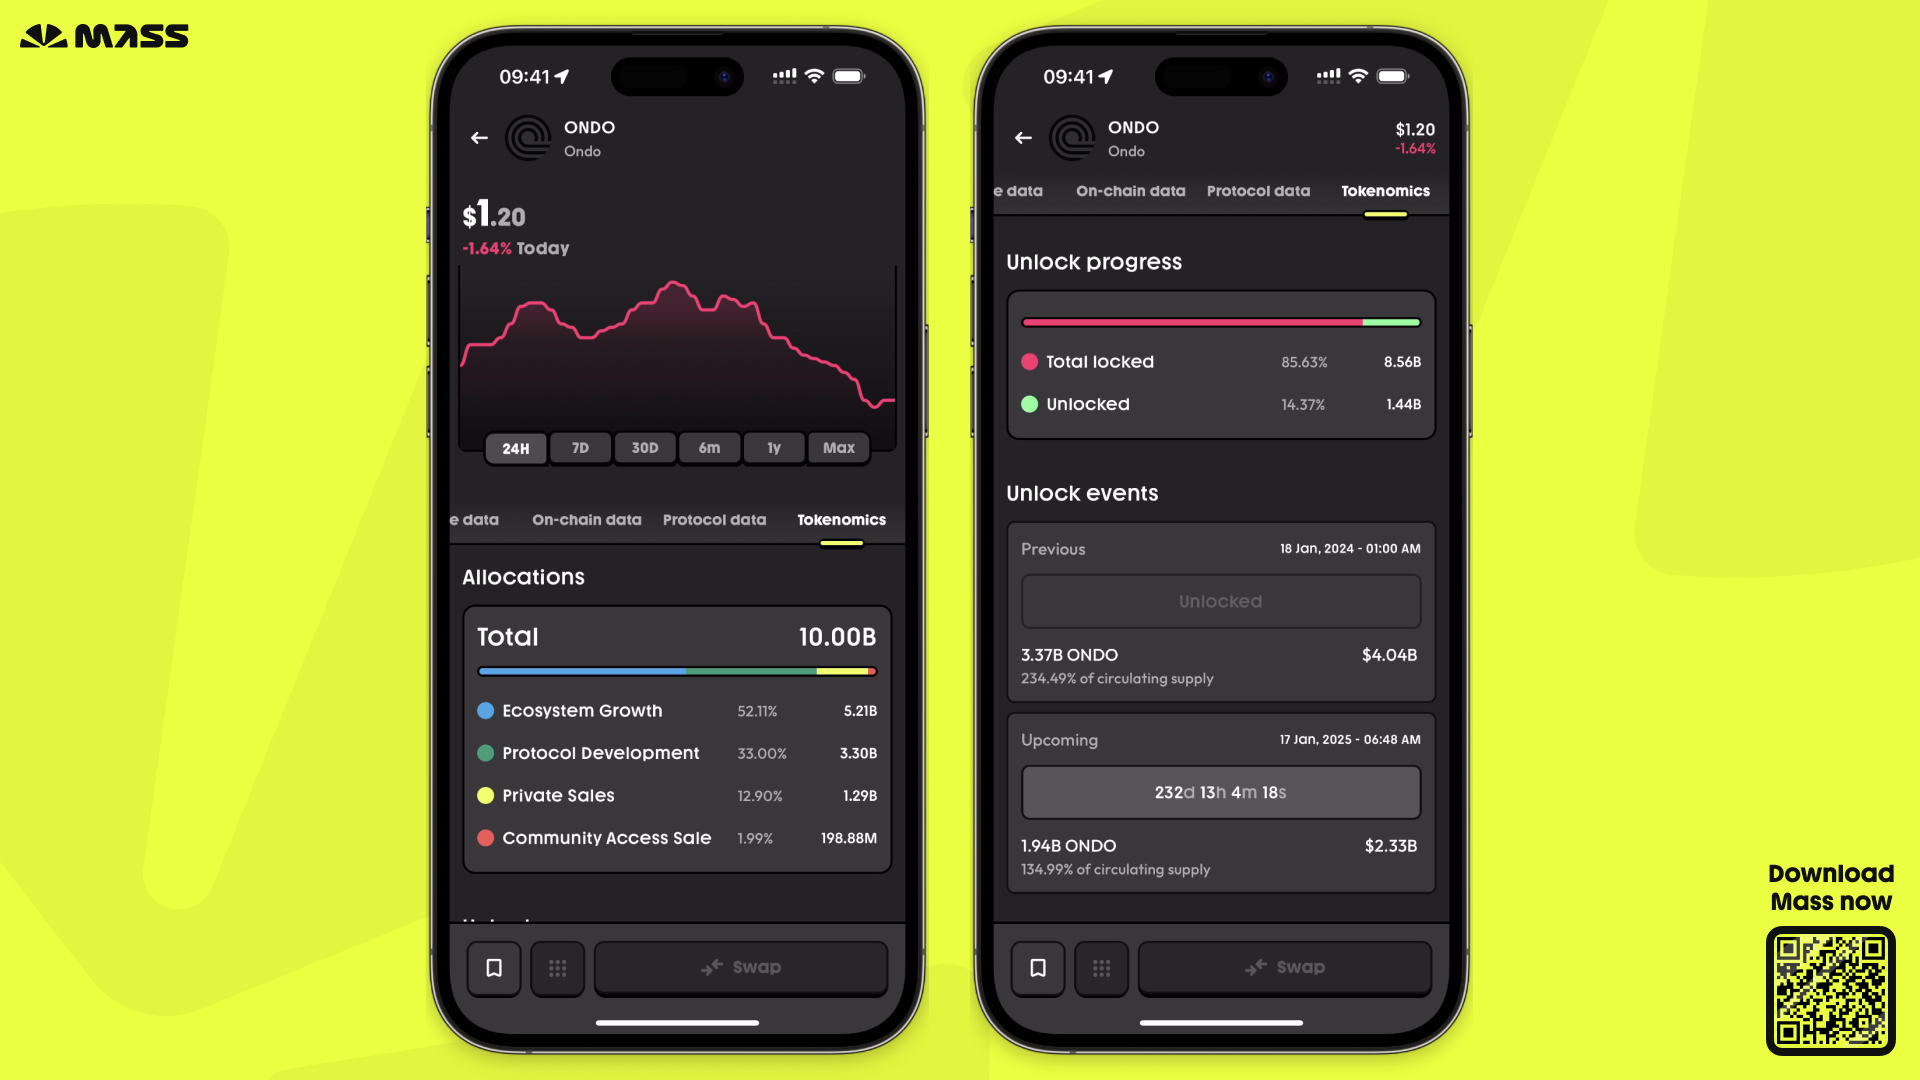
Tokenomics 🔒
This tab shows the supply distribution, the upcoming unlocks, and the percentage of the supply still locked.
With only 14% of the supply unlocked and no additional unlocks until January 17, 2025, $ONDO holders should not fear additional selling pressure and can enjoy a nice ride 🌕
You can trade smarter 💰
You can invest wisely 👼
You can be more knowledgeable 🧠